
SkyTrak+ has become one of the most talked-about launch monitors under $2,000. Golfers want to know if it’s really as accurate as the high-priced gear used on Tour ranges. The short answer: it promises near–pro-level data without the $20k price tag.
Still, promises are cheap; numbers are not. That’s why this breakdown looks strictly at accuracy. You’ll see what SkyTrak+ measures, how it measures and how those readings compare in both robot testing and real-world swings.
If you’re deciding whether to trust SkyTrak+ for practice, fittings or sim play, this guide clears the fog. Expect straight talk on its strengths, its weak spots and what those details mean for your game.
Quick Answer: How accurate is SkyTrak+?
SkyTrak+ sits close to the big names in launch monitoring without emptying your wallet. Independent testing shows it within about 2 yards of monitors costing nearly twenty times more. That means your 7-iron shot at 160 yards shows up almost the same as it would on a Tour van’s $20k setup.
Even more telling, angles, including launch, face and path, come within roughly 1.5 degrees of TrackMan readings. If you’re used to eyeballing ball flight on the range, that margin is tighter than most players could ever spot.
What does this mean for you? Expect skytrak ball speed accuracy that holds steady within 1–2%, which is the number driving distance math. You’ll see carries and totals that mirror reality, with driver accuracy keeping big sticks honest. Minor blips show up mostly in certain club data points, like swing speed, but they don’t change ball flight enough to mislead your practice.
SkyTrak+ Data Points: What does SkyTrak Plus measure?
Before you can decide how accurate SkyTrak+ is, you need to know what it actually tracks. The system gathers both ball and club data, giving you numbers that explain not only what the shot did but also why it happened.
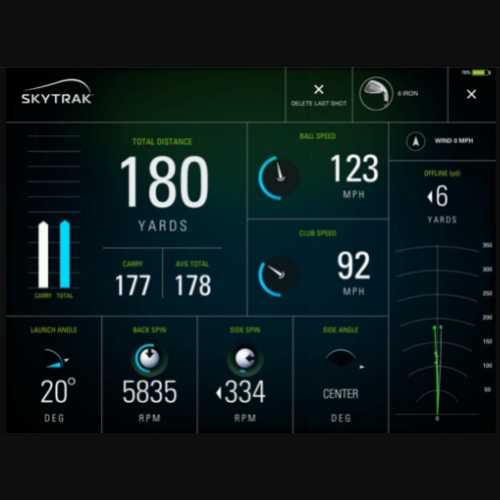
Ball data
SkyTrak+ captures ball speed, launch angle, backspin, side spin, and spin axis. Carry and total distance show up after the math (calculated), along with side angle, descent angle, peak height, and shot shape.
These readings are what let you compare a wedge that floats high against one that pierces through wind.
To ensure those readings stay consistent, ball placement on the hitting zone is critical. Our step-by-step guide on SkyTrak+ ball positioning explains how proper alignment affects distance, accuracy, and shot shape so you can avoid misreads and get the most reliable data.
Club data
On the club side, skytrak club data adds another layer. You’ll get club head speed, smash factor, club path, face angle, and face to path.
Those numbers make it clear whether you’re delivering the club square, swinging from the inside or leaving the face open.
Scope vs. original model
The original Skytrak stopped short with ball-only data, while SkyTrak+ expands into direct club tracking. That difference means you don’t just see what the ball did, but you get clues about why it behaved that way. And once you understand that, the game starts looking very different.
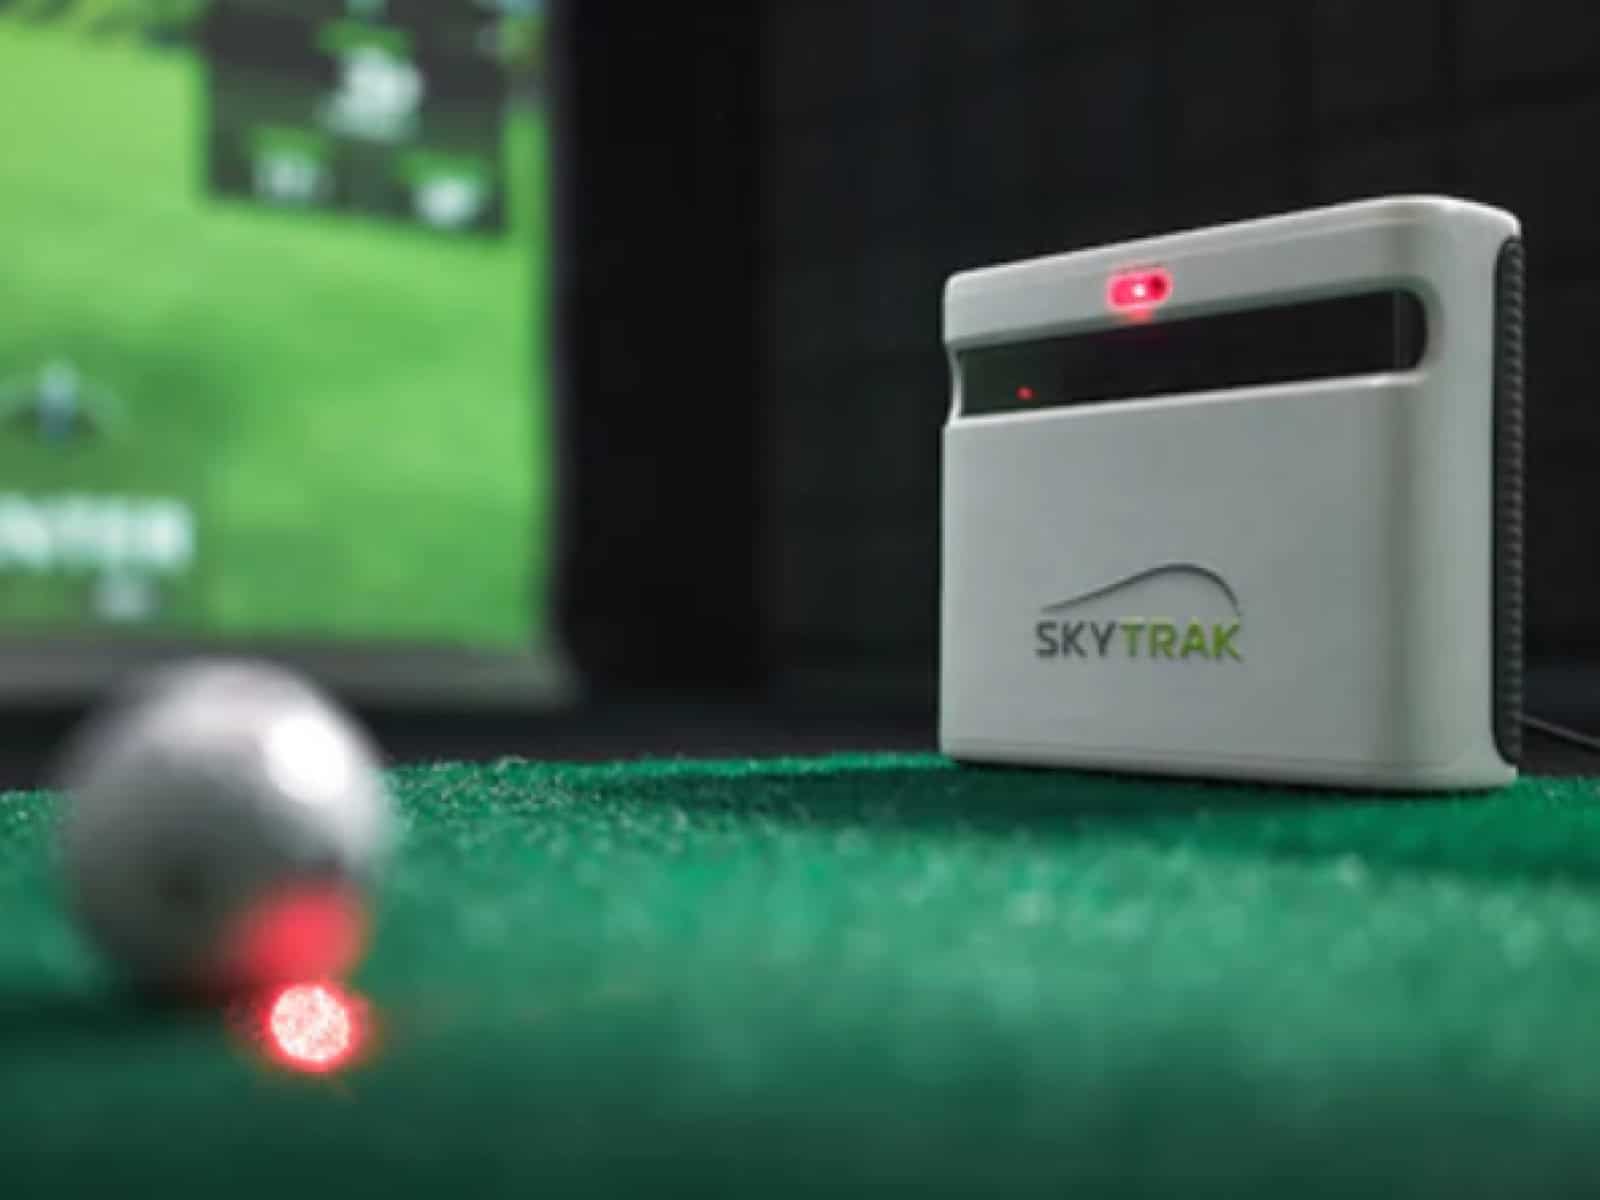
Measurement Methods: How SkyTrak+ captures the numbers
Numbers don’t appear out of thin air. SkyTrak+ leans on two different tracking systems that work together to paint the full picture of your swing and ball flight.
Dual Doppler Radar for club tracking
Radar measures the club as it moves through impact. You get data on path, face angle, face-to-path, and club head speed without the hassle of sticking dots on your club. It’s like having a slow-motion replay of your swing, only in numbers instead of frames.
Photometric Cameras for ball launch
High-speed cameras focus on the ball at the exact moment it takes off. They read ball speed, launch angle and spin characteristics with remarkable consistency. The images become the raw material that the software turns into data points you can trust.
Machine-Learning Refinement
Here’s where the tech gets clever. Algorithms combine radar and camera inputs, compare them to thousands of swings and adjust for better consistency.
That blend means fewer misreads and a more reliable picture of what you actually did.
Accuracy by Metric: Where SkyTrak+ shines (and where it varies)
Not every number carries the same weight, and not every metric is equally tight against pro-grade monitors. Some shine bright, while others show small gaps you’ll want to keep in mind.
SkyTrak ball speed accuracy
Ball speed is the heartbeat of every shot, and skytrak’s accuracy here usually lands within 1–2% of premium monitors. That small margin means your 6-iron carry on SkyTrak+ mirrors what you’d see on the course.
Without dependable ball speed, distance gapping becomes guesswork, but here you can trust the number.
Launch, spin and spin axis
Launch angle and spin readings come through steady indoors and on solid mats. Spin axis, the measure that shapes a draw or fade, also tracks well.
When your ball curves more than expected, SkyTrak+ usually calls it out. If you’ve ever guessed why a ball peeled into the rough, now you’ll have data backing up the story.
Club metrics: path, face-to-path and club head speed
The club path and face to path numbers sit close to those from pro units. For most swings, they tell you if you’re attacking from inside or cutting across.
Club head speed holds up too, though you may notice slight shifts with certain clubs or test setups. Still, the patterns make sense, and that’s what helps you change ball flight on purpose.
Distance, dispersion and driver accuracy
Carry and total yardages track tight to reality, which matters when you’re mapping your bag. Dispersion circles reflect your shot tendencies, not a random guess.
And when you pull out your driver, accuracy holds steady. Rollout varies depending on turf settings, but the carry is spot on.
Real-World & Robot Testing: What the data shows
Data in a lab can look perfect, but golf rarely happens in perfect conditions. That’s why both robot swings and player testing matter when judging SkyTrak+.
Controlled (robot) testing
Robot tests at golf laboratories show SkyTrak+ holding its own against high-end monitors. Ball speed, launch and spin numbers match so closely they’re nearly indistinguishable. Robots don’t lie, and that consistency tells you the hardware and software are tuned perfectly.
Player testing and third-party comparisons
Things get interesting once human swings enter the picture. Independent tests report carries within 2 yards of top units and angles within about 1.5 degrees of TrackMan.
For you, that means your 5-iron yardage won’t surprise you when you step onto real turf.
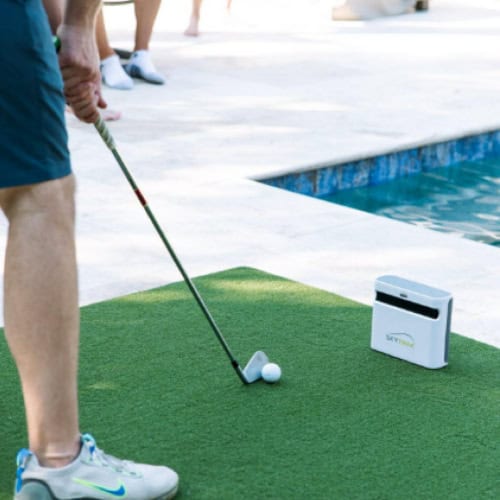
Environment effects
Indoors, SkyTrak+ thrives with steady lighting and controlled surfaces. Outdoors, mats still give solid reads, but harsh sunlight and shiny surfaces can tweak spin readings. Even then, dispersion and distance remain close enough to trust.
Limitations and Known Variances
SkyTrak+ is strong across most metrics, but a few small gaps show up depending on how and where you use it. Knowing these helps you read the data with clear eyes.
Club speed variance
Club speed can drift depending on the head or shaft. A lightweight driver might read a little high, while a heavier wedge can show lower numbers. The changes don’t throw off ball flight much, but you may notice if you track club head speed closely.
Spin axis sensitivity
Spin axis and side spin can be influenced by harsh lighting or reflective mats. Bright sun or glare sometimes nudges the cameras into misreading curve. A straight shot may look like it has fade, or a mild draw could appear exaggerated.
Rollout assumptions
Distance carry is steady, but rollout depends on the ground model built into the software. Firm links-style settings produce different totals than soft parkland assumptions. You’ll want to keep that in mind if you rely on the simulator for gapping practice.
Frequently Asked Questions
Here are quick answers to common questions you might be asking about SkyTrak+ accuracy and features.
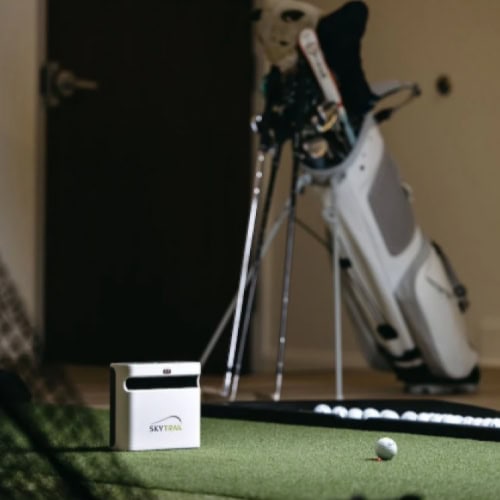
How accurate is SkyTrak golf simulator data indoors vs outdoors?
Indoors it performs best because the environment is controlled. Outdoors on mats it still gives solid results, but glare, shadows or uneven surfaces can affect spin and curve. Launch angle and carry distance remain dependable in both settings.
Is SkyTrak club head speed accurate for all clubs?
Yes, for most swings it’s very reliable. Small differences may appear depending on the club type, shaft weight or tee height. Drivers and longer clubs can show slight variations, while irons and wedges usually stay closer to expected numbers.
Does SkyTrak+ report angle of attack?
It doesn’t provide angle of attack directly. Instead, you can read it indirectly by looking at launch angle, spin and club path data. These signals help you figure out if you’re hitting down or up on the ball.
How to make SkyTrak more accurate in a home setup?
Start with a level unit and place the ball in the marked hitting zone every time. Good lighting helps the cameras read spin, while quality mats and balls improve consistency. Stable Wi-Fi also keeps the data flowing without hiccups.
What does the original SkyTrak measure vs SkyTrak+?
The first SkyTrak was built for ball data only, with limited club insights. The Plus version adds Doppler radar to capture club speed, path and face angle, along with sharper spin tracking from improved cameras.
How to read SkyTrak data and the Shot Optimizer?
Focus on ball speed, launch angle and spin to understand distance and trajectory. Then use spin axis to see curve. The Shot Optimizer’s red, yellow and green gauges make it simple to know if you’re inside the right window for your swing.
What does SkyTrak Plus measure that matters most for fittings?
The most useful numbers are ball speed, spin rate and launch angle because they directly affect distance and gapping. Club path and face-to-path readings show how the ball starts and curves, helping fitters fine-tune shafts, lofts and lies.
Final Thoughts
SkyTrak+ proves you don’t need a tour budget to get tour-level numbers. By pairing radar with cameras and leaning on machine learning, it delivers readings that hold up against monitors costing ten times more. For you, that means your carry yardages, launch angles and spin rates are reliable tools for practice and fittings.
Where it shines is ball flight. The system nails speed, launch and spin with accuracy that keeps your simulator rounds believable and your gapping work honest. Club data like club path, face to path and club head speed give you enough feedback to spot patterns and fix issues without drowning you in complexity.
Yes, small quirks exist. Lighting can push spin axis off. Certain shafts may cause slight speed variance. Rollout changes with assumed turf. But those gaps are small compared to the confidence you gain from having highly reliable data in your garage.
So the bigger question is this: if you could trust the numbers at home, how much sharper would your game feel the next time you step onto the course?
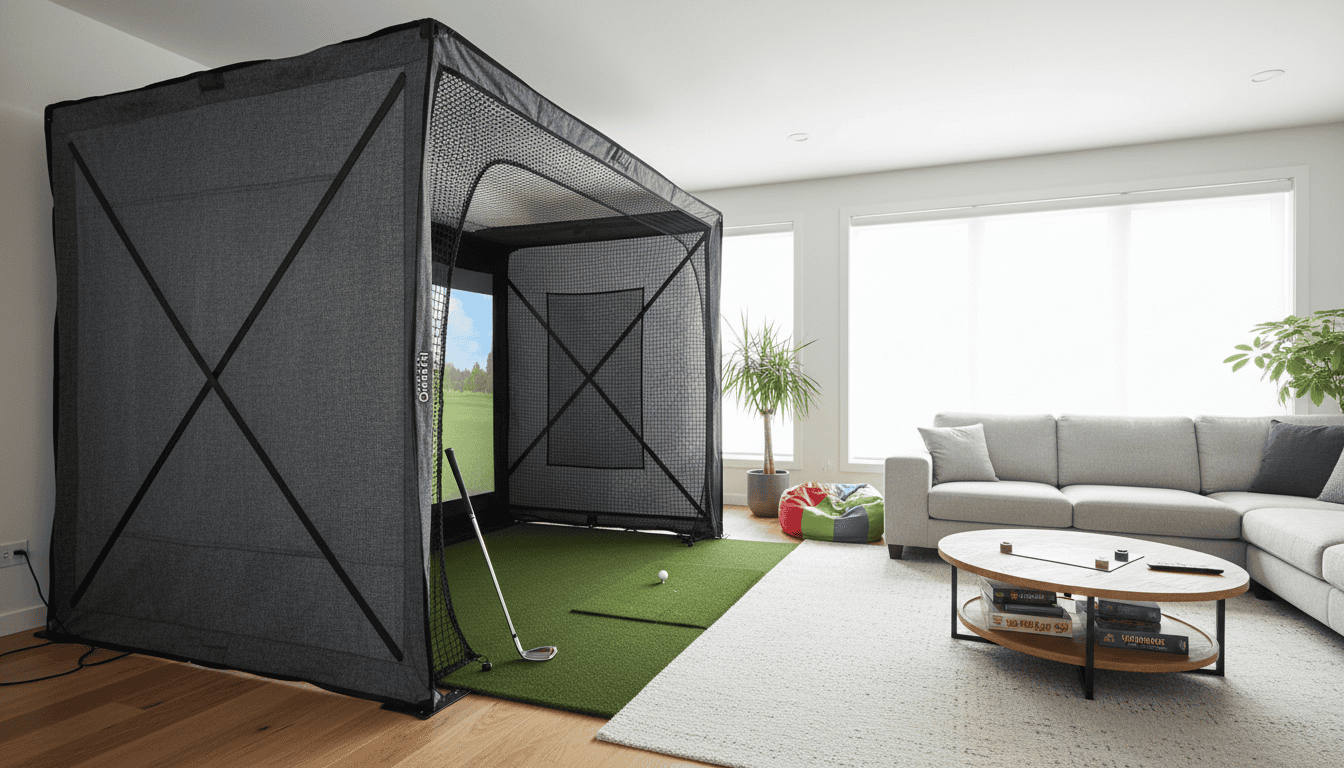
To get the most consistent results from your launch monitor, it’s just as important to set up your hitting area correctly. Our detailed guide on room setup for SkyTrak+ covers minimum space, ceiling height, and positioning tips so you can avoid misreads and maximize accuracy in your home simulator.