
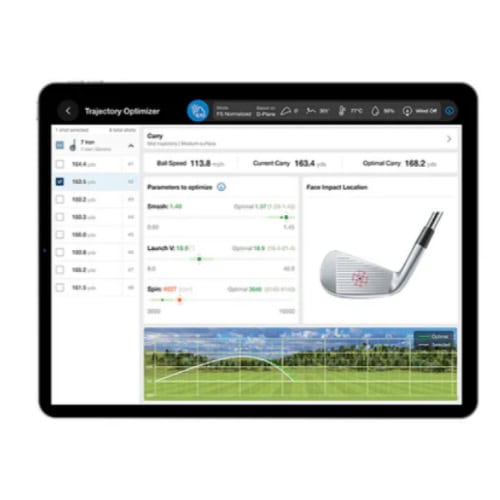
FlightScope’s X3 launch monitor uses Fusion Tracking—3D Doppler radar plus synced high-speed imaging—to read putts and short shots with steady accuracy, indoors or out. You get 12 putting parameters that tell the truth about pace, start line, strike, and roll.
Better yet, you’ll see why that matters. Coaches and fitters can diagnose cause, not just the miss.
By the end, you’ll know what the 12 metrics are, how they sharpen lessons and fittings and how X3 stacks up against the Mevo+ and Gen2, which only show three basic putting numbers.
Note on the X3 and X3C Tracking Capabilities
Before we dig deeper into the details of the X3’s short game tracking, it’s important to note that both the X3 and X3C launch monitors offer the same level of accuracy and the same performance and number of metrics since they share the same tracking hardware and software; the differences between the two are purely cosmetic.
So while our article focuses on the X3, everything can be applied to the X3C, too. You can also check out our detailed comparison of the X3 and X3C.
Quick Answer: The 12 FlightScope X3 Putting Parameters
When you roll a putt, every inch of motion tells a story. The FlightScope X3 captures that story with 12 data points that go far beyond simple speed or direction. These parameters give you the full truth about how the ball leaves the face, moves across the green and finally comes to rest.
- Launch Speed – The ball’s initial velocity off the putter face. It shows how your tempo and contact translate into roll distance.
- Total Distance – Tracks how far the ball travels from impact to stop, helping you connect stroke length with outcome.
- Ball/Launch Direction – Measures where the ball starts relative to your target line, revealing alignment and face control.
- Face Impact Location – Pinpoints where the strike happens on the putter face: heel, toe or center. It’s the mirror to your consistency.
- Stroke/Path Direction – Maps the putter’s travel direction through impact, highlighting in-to-out or out-to-in tendencies.
- Face Angle at Impact – Tells if your face is open or closed when it meets the ball, crucial for starting the ball online.
- Angle of Attack – Reads whether the putter is moving up or down through impact, shaping how the ball launches and rolls.
- Skid Phase Duration – Measures the brief slide before pure roll, exposing issues with loft or surface interaction.
- Bounce/Skid Characteristics – Visualizes how the ball interacts with the turf in its first inches of travel (tiny details, big results).
- Roll Distance / Roll Efficiency – Shows how well your stroke energy converts to roll rather than bounce or skid.
- Impact Velocity Variability – Reflects how stable your stroke speed is from putt to putt, a direct line to consistency.
- Putt Travel Time – Times the ball’s journey from strike to stop, connecting feel with measurable performance.
Every one of these numbers adds a piece to the puzzle. Together, they give instructors and fitters a clear window into what your eyes and ears can’t always catch.
Why These Metrics Matter for Instructors & Fitters
Numbers alone don’t fix a stroke. You do. But when those numbers come from the FlightScope X3, they point you straight to the truth. Each metric shows how cause meets effect—where face, path and impact shape what the ball actually does.
Targeted Stroke Diagnostics
A missed putt isn’t just a bad read. Sometimes the face was one degree open, or the stroke swung slightly inside. The X3’s putting data turns those “maybes” into facts.
You’ll see where the breakdown starts (angle of attack, path or contact point) so instruction becomes sharp, not vague. Instead of telling a player to “smooth it out,” you can prove why a stroke misfires.
Precision Putter Fitting
Finding the right putter is like matching fingerprints. No two strokes are alike. With roll efficiency, launch direction and face impact location, fitters can match loft, lie and head design to how a player truly delivers the club.
You’ll stop guessing which putter feels right and start measuring which one performs right.
Distance Control & Calibration
Every golfer says they “can’t find the pace.” Launch speed and total distance change that. These metrics let you map stroke length to roll distance on any green speed.
Instructors can build drills that teach distance control you can trust instead of relying on feel alone.
Consistency Tracking Over Time
You can’t manage what you can’t measure. Variability metrics, like impact velocity consistency, show how stable a player’s tempo and strike are day to day. That’s gold for tracking improvement. The next time a student feels “off,” you’ll know whether it’s perception or proof.
Surface & Conditions Adaptation
Grass changes, humidity shifts and green speeds never sit still. The X3 shows how roll and decay behave on each surface so you can tune your putting for every condition. It’s like having a weather forecast for your short game; one that never lies.
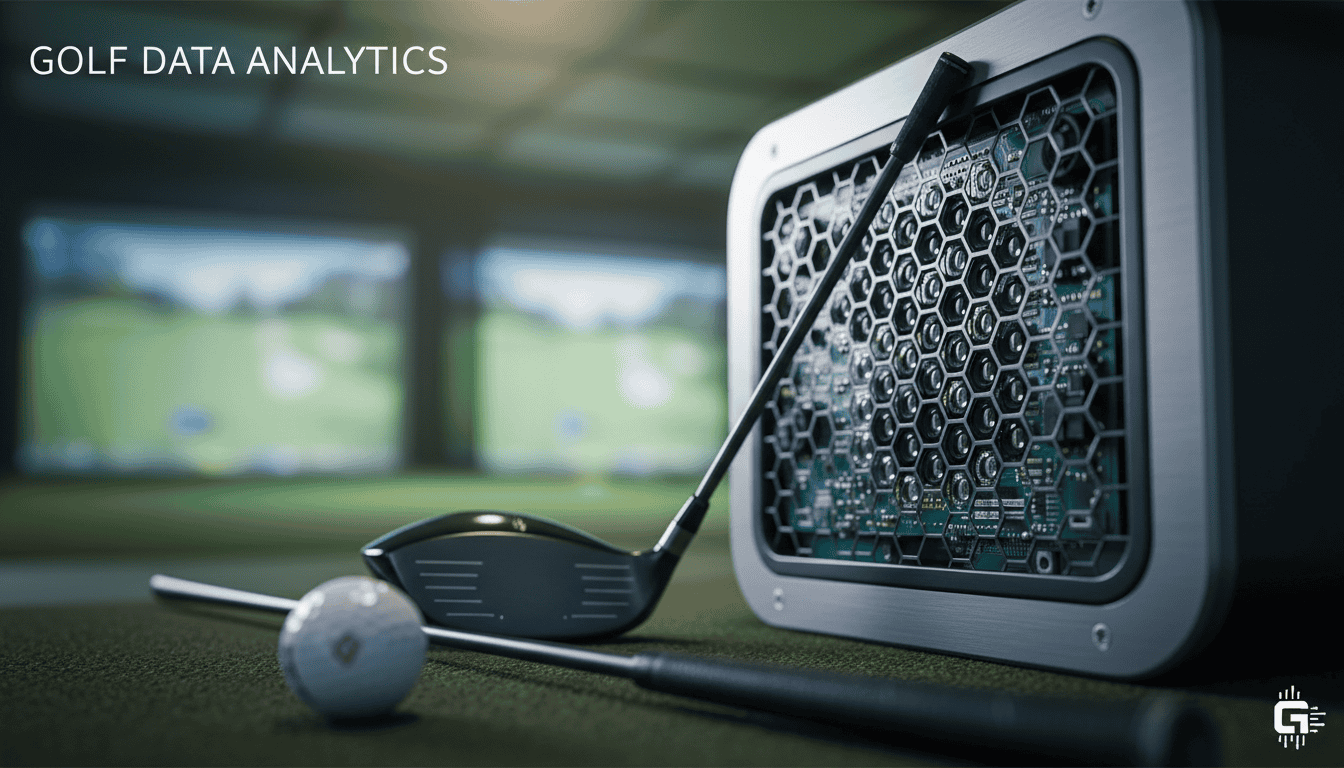
Fusion Tracking: How the X3 Captures Short-Game Data Reliably
The magic behind FlightScope’s X3 is Fusion Tracking. It’s not just radar, and it’s not just cameras—it’s both, working in harmony. The system pairs 3D Doppler radar with synchronized high-speed imaging to measure every tiny detail of your stroke. You see what happens at impact, not what you think happened.
Radar + Image Synchronization
Radar alone struggles with the slow speeds of putts and delicate chips. The X3 solves that by blending radar tracking with image verification. The radar reads ball flight and club motion in three dimensions, while the cameras catch impact and roll behavior the radar can miss. Each frame of data cross-checks the other, which means your short-game readings stay accurate, no matter the speed or spin.
That’s why you can trust the numbers. They aren’t modeled guesses; they’re verified facts built from both radar and vision.
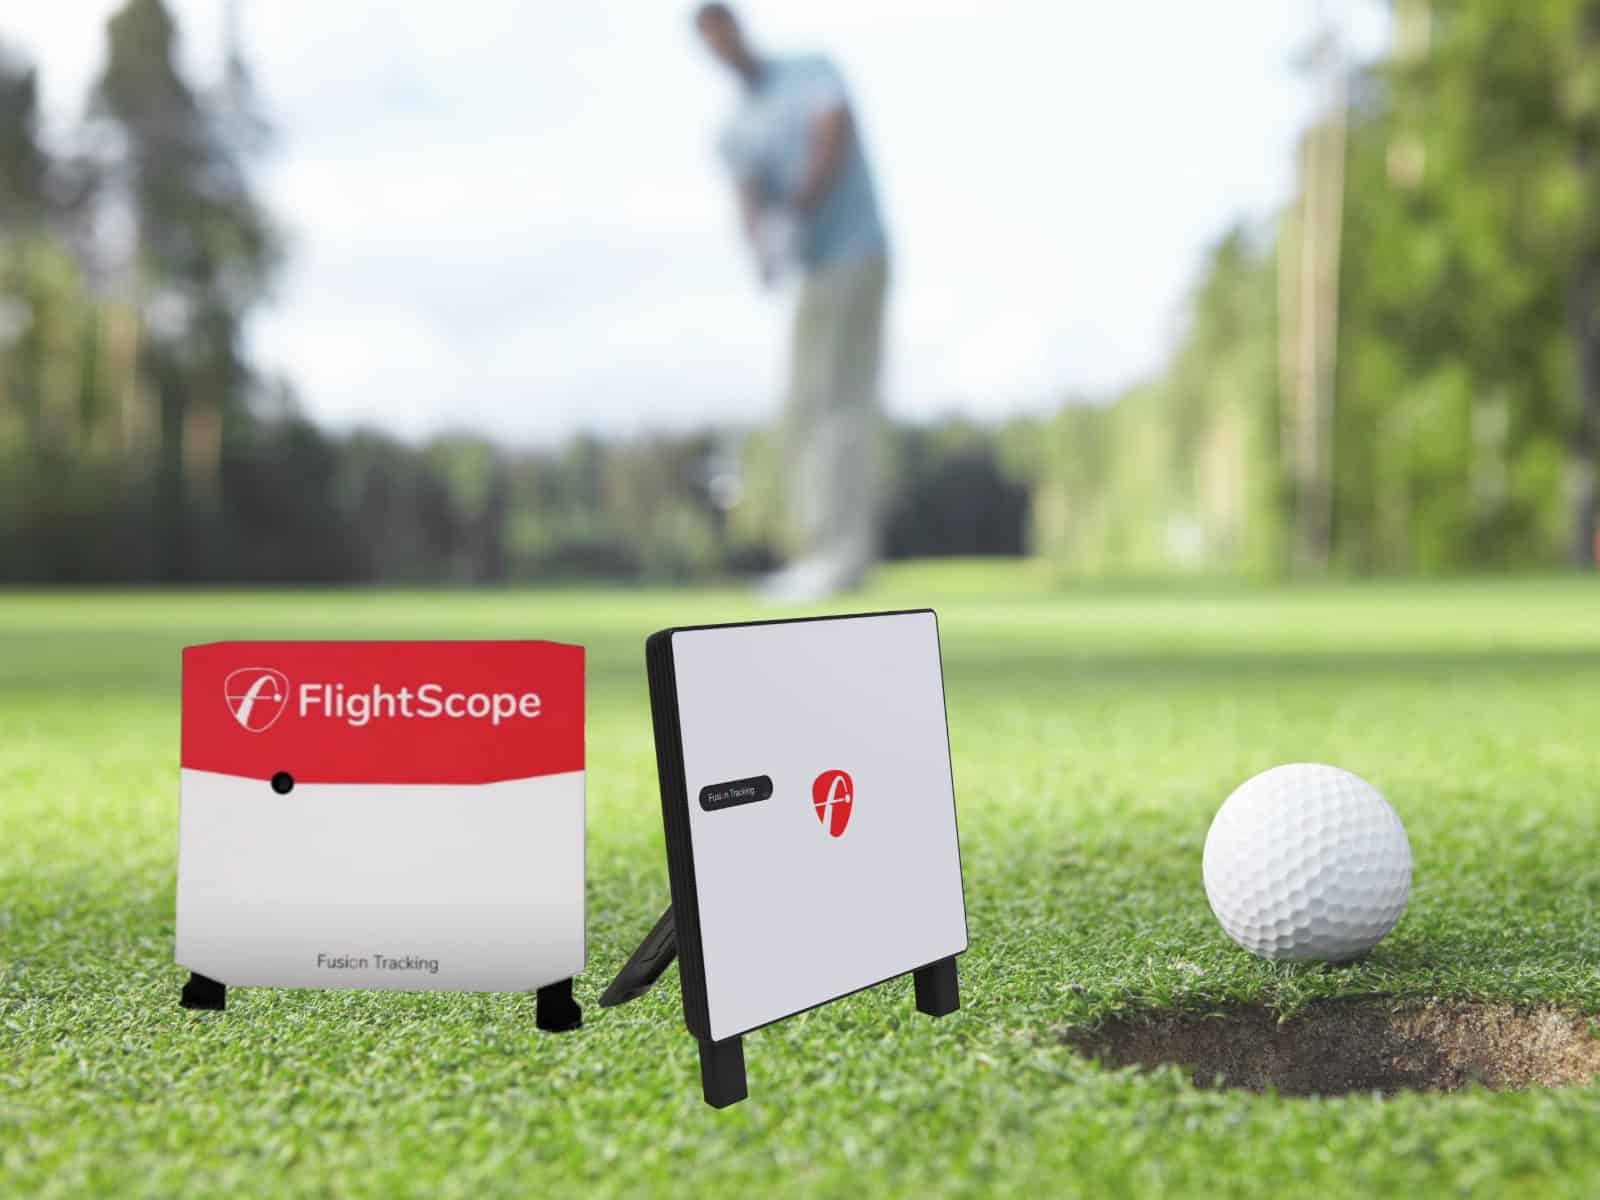
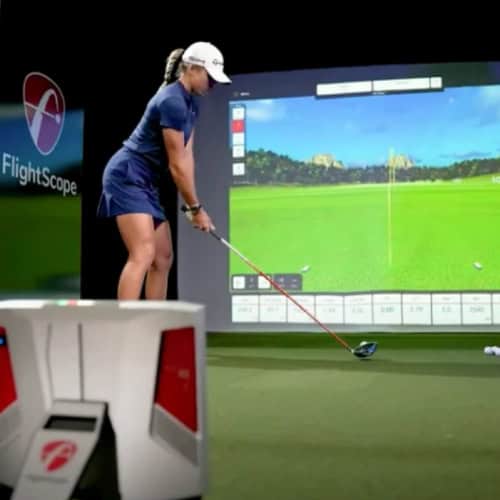
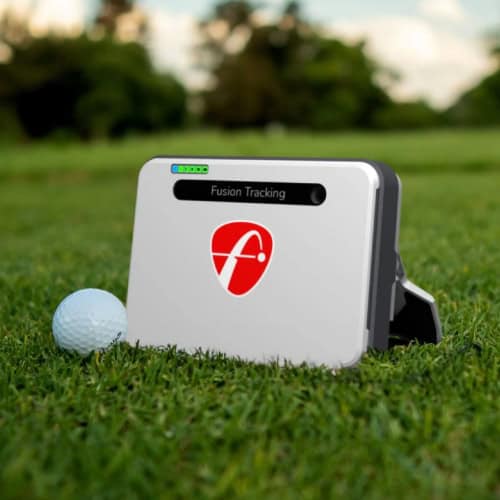
Indoor & Outdoor Versatility
Conditions shouldn’t dictate how well your tech performs. Whether you’re rolling putts in a studio or chipping into a breeze, the X3 adapts. It automatically adjusts its sensors for lighting, distance and trajectory, keeping your putting and wedge data sharp.
You can even overlay video with metrics in real time, letting you see how motion and data line up. That kind of feedback turns every stroke into a lesson; one you can replay, refine and repeat until it’s second nature.
If you want a broader look at how this system performs beyond the short game, our X3 launch monitor review breaks down its full-swing accuracy, data parameters, and real-world value for both indoor and outdoor setups.
X3 vs Mevo+ / Mevo+ Gen2: Putting Metrics at a Glance
The Mevo+ and Gen2 give you the basics: launch speed, total distance and ball direction. That’s enough to gauge pace and start line, but it’s like reading the first chapter of a book and missing the rest. You get a sense of what happened but not why it happened.
The X3 fills in the missing pages. With its 12 putting parameters, it reveals everything that shapes a putt, from face impact location and stroke path to roll efficiency and bounce behavior. Instead of just tracking the ball, it explains the full cause-and-effect chain between stroke and roll.
That’s what makes the X3 a professional tool. It doesn’t guess or model; it measures. Fusion Tracking captures both radar and visual data so every reading is cross-verified. You see the subtleties: how a slight change in face angle turns a make into a miss, or how angle of attack affects roll on different green speeds.
For instructors and fitters, that difference is night and day. While the Mevo+ offers a snapshot, the X3 gives you a full MRI of your stroke, with every motion, every microsecond, every impact detail laid bare.
Short-Game Beyond Putting: Chipping & Wedge Data That Complements Putting Work
The short game wins matches. Yet most players overlook the data that shows why their chips and pitches stop short or skip long. The FlightScope X3 fixes that blind spot with detailed short-game analysis that mirrors its putting precision. It tracks club and ball behavior through impact, giving you hard evidence of what the hands and eyes often miss.

D-Plane & Impact Dynamics
Your wedge swing lives on the D-Plane, the invisible plane formed by your club path and face angle. The X3 measures it, showing exactly how your club’s approach and face position interact at impact. You’ll see if your path drifts outside, or if the face is too open at contact. Add in angle of attack, and you can see how steep or shallow your strike should be for clean, controlled spin.
Spin Axis, Angle of Descent, Lateral Landing
Curvature and stopping power come from more than just technique. The X3 tracks spin axis to reveal if your wedge shot has unwanted side spin pulling it off line. Then it shows the angle of descent (the steepness of your ball’s landing) and where it actually touches down relative to target. That’s your dispersion pattern in black and white. Tighten that, and your proximity to the pin shrinks fast.
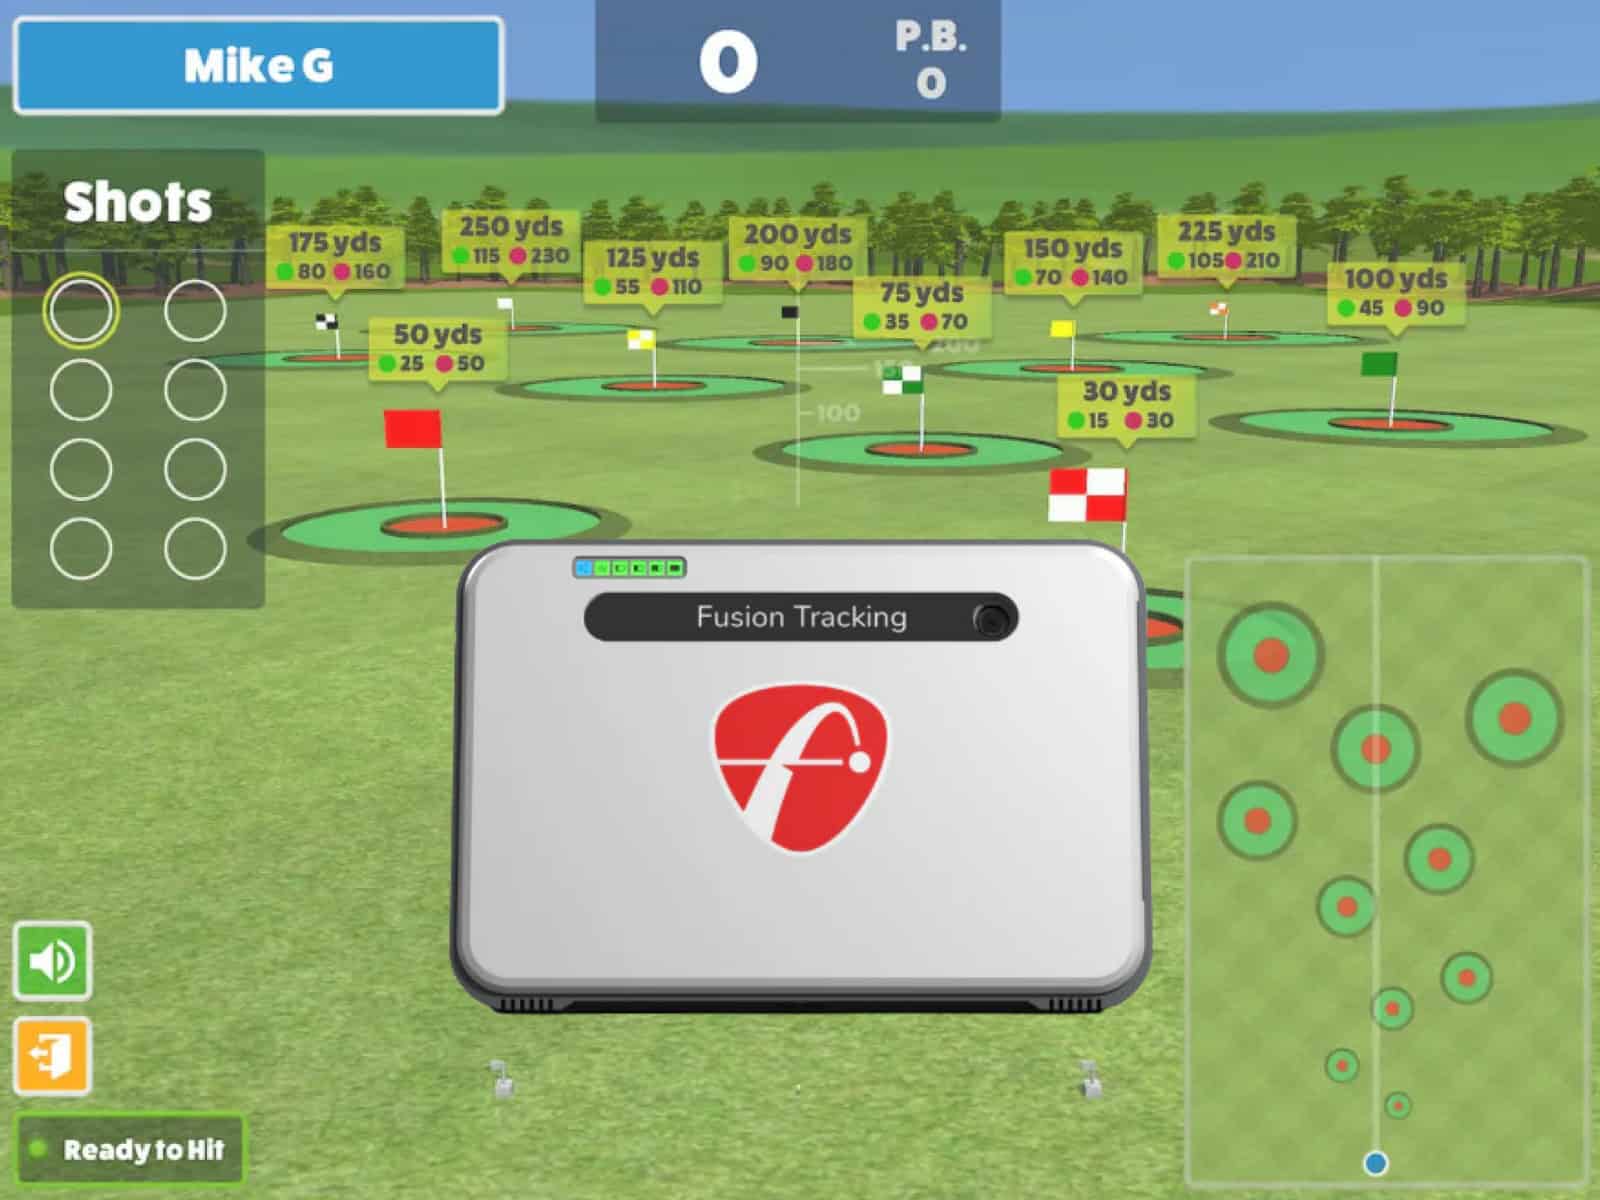
Skills Assessments
Consistency only comes from feedback. With Skills Assessments, you can build custom short-game challenges, measuring carry distance, rollout and landing zones. You’ll know whether progress is real or imagined. For instructors, it’s proof. For players, it’s motivation.
Frequently Asked Questions
Before diving into the finer details, here’s a quick look at some common questions golfers ask about the FlightScope X3 and its putting and short-game performance. These answers add extra context to help you get the most out of the technology.
Does the FlightScope X3 integrate with simulator software for putting?
Yes. It works with leading simulation platforms like E6 Connect, The Golf Club 2019 and Creative Golf 3D, allowing you to putt and chip in simulated environments while collecting real data.
Can the FlightScope X3 be used outdoors in windy conditions?
Yes, Fusion Tracking adjusts for environmental factors such as wind or humidity. It maintains accuracy for both short and full shots, even when the air moves or temperatures shift.
What setup distance is required for putting?
You typically need about 6–8 feet behind the ball and at least 8 feet of ball travel. This ensures both radar and camera systems capture complete data.
How long does it take to switch from full-swing to putting mode?
Just seconds. The FlightScope X3 automatically adjusts when detecting different shot types, so there’s no manual calibration or separate setting needed.
Is there a way to export putting and chipping data for analysis?
Yes, you can export data sessions directly from the FS Golf app into spreadsheets or reports, ideal for instructors tracking progress or fitters comparing multiple putters.
Can the X3 track side spin or off-center strikes in wedges?
It can. The system measures spin axis and impact location on wedges, helping you identify when a miss-hit or off-center contact affects spin or trajectory.
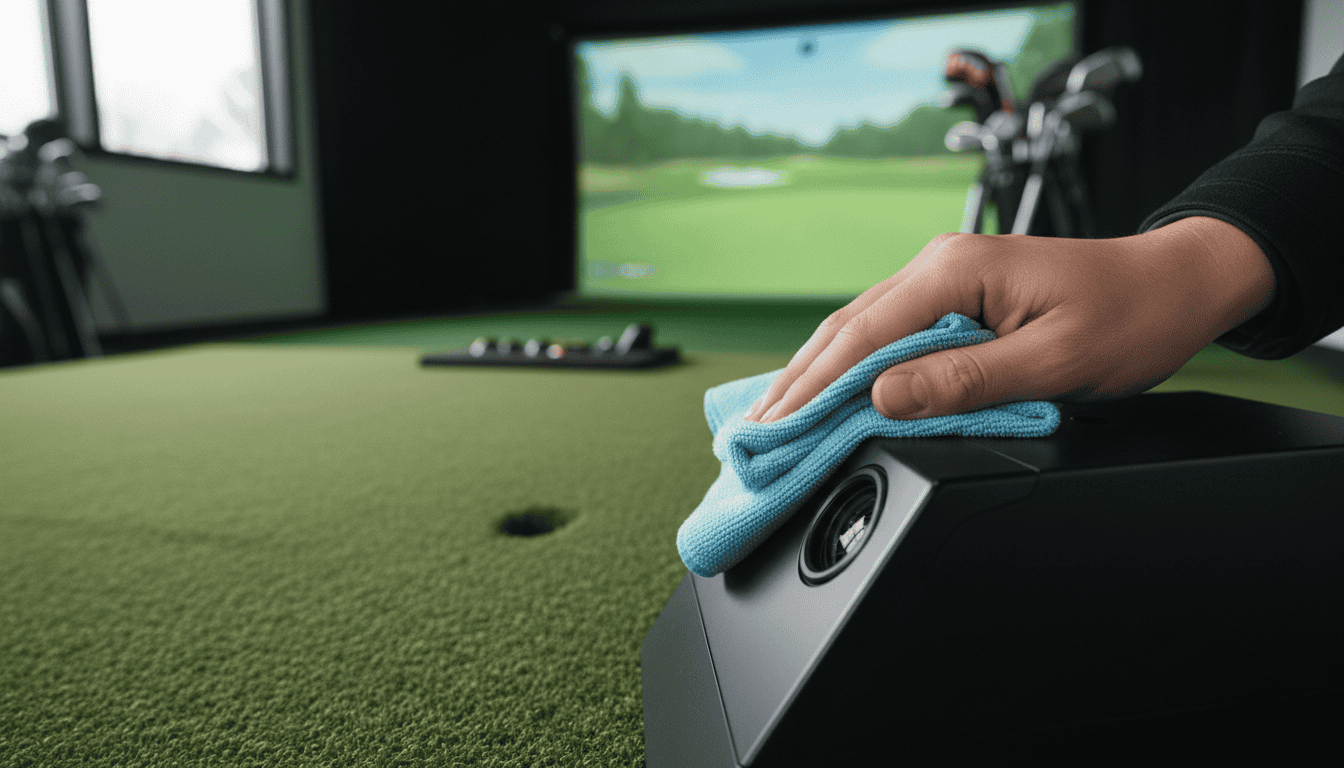
What kind of maintenance or calibration does the unit need?
Minimal. The X3 auto-calibrates its sensors during each power-up. Keeping the lenses clean and ensuring a level setup area are usually all that’s required for consistent accuracy.
Final Thoughts
The FlightScope X3 isn’t just another launch monitor—it’s a short-game truth teller. With its Fusion Tracking system blending radar and camera data, it delivers unmatched accuracy on both full swings and the delicate strokes that decide matches.
You get 12 putting parameters that expose every hidden flaw or strength in your stroke. Add in its chipping and wedge data like spin axis, impact location and angle of descent, and you’ve got the most complete short-game picture available today.
For instructors, it means precise teaching and clear progress tracking. For fitters, it means data-backed confidence when choosing loft, lie and head design. And for you, it means understanding exactly how your putts and chips behave, every single time.
Once you’ve seen that kind of detail, you’ll never go back to guessing.